I’m a big believer in simple solutions. It’s not that I shy away from complex problems. It’s just that in the heat of technical work, it’s easy to overengineer things, which ultimately makes our lives harder. I ran into this exact issue while analyzing and presenting performance test results.
On a daily basis, I use the Locust framework for testing. Out of the box, it offers a nice UI for tracking current results, allows data export to CSV, and supports integration with Prometheus and Grafana.
Prometheus and Grafana are, of course, a great combo for monitoring real-time metrics. The problem arises with historical analysis. Due to the massive amount of collected data and retention policies, going back to older test results can be difficult, or sometimes even impossible. Additionally, Grafana has a relatively high barrier to entry if you want to build custom views. Out-of-the-box dashboards rarely make it easy to simply compare two specific test runs side-by-side to definitively assess whether performance has improved, degraded, or remained stable.
My team needed a straightforward answer to one simple question: is our backend still as fast as it was?
I was missing a tool that could give us that answer right away. Locust allows exporting results to CSV, which you can obviously automate and write a script to compare the files, but you’re still working with raw data.
So, I decided to take matters into my own hands and build a lightweight online tool (assuming there are more QAs and SDETs out there facing the exact same problem). The goal was a fast, clear comparison of Locust results in a format that’s easy to tweak to your needs. That’s how https://locustcompare.com came to be.
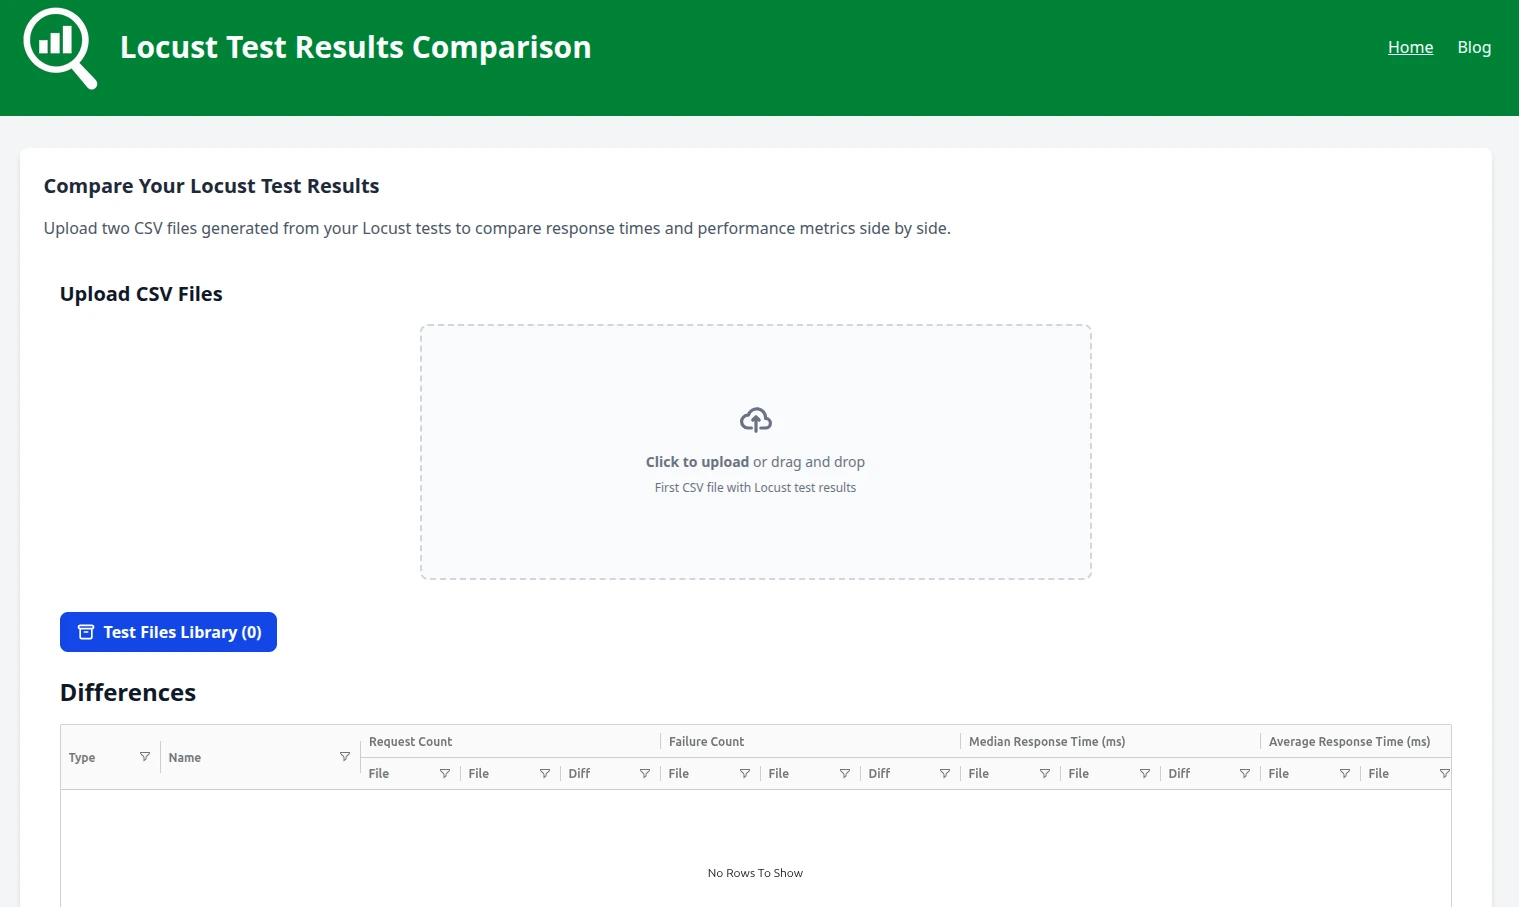
My inspiration came from sites like Diffchecker. I focused on three core pillars:
- Speed and simplicity: The tool should do one thing, and do it well.
- Privacy (Client-side processing): File processing happens entirely in your browser. Test results are never uploaded to any server, meaning your company’s data remains 100% secure.
- Clarity: The interface must be flexible and easy to customize.
On the tech side, the project is built on the Astro framework, Tailwind CSS, and the AG Grid library, which does an amazing job rendering tables.
If you use Locust in your projects and need a quick way to compare two test runs, I highly encourage you to give the tool a try and share your feedback!